Sales & Marketing Dashboard Training
Sales teams are the driving force behind your business. You drive revenue, and your efforts are the first thing that your CEO talks about with the board or shareholders. Your sales numbers are top of mind for everyone in the business.
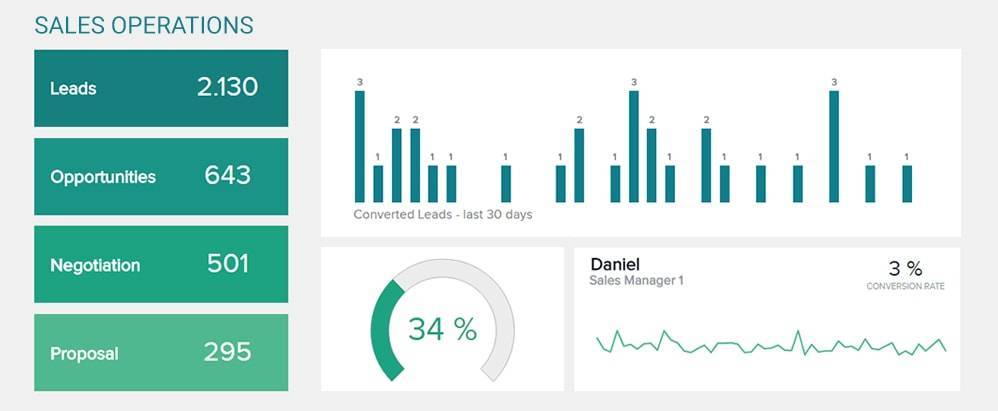
This interactive sales activities dashboard example shows how you can sync your Salesforce or other CRM systems to better visualize your sales pipeline and process. Using this dashboard, you get an at-a-glance look into your total won opportunities, total won amount, and average length of sale. You’ll also gain a better understanding of your won opportunities by examining the lead source, account manager, length of sale, and trends.
Topics Covered
Most commonly used Sales Metrics
The top metrics for modern sales teams and sales executives are:
- Monthly Sales Growth
- Average Profit Margin
- Monthly Sales Bookings
- Sales Opportunities
- Sales Target
- Quote To Close Ratio
- Average Purchase Value
- Monthly Calls (or emails) Per Sales Rep
- Sales Per Rep
- Product Performance
- Sales by Contact Method
- Average New Deal Size/Length
- Lead-to-Sale %
- Average Cost Per Lead